1 Soil Texture, Color, and Structure
- Use the Bouyoucos hydrometer to determine soil particle distribution.
- Use the textural triangle to determine the soil textural class name.
- Use the texture by “feel” method to determine soil textural classes.
- Determine soil color using Munsell notation.
- Describe different soil structure characteristics and determine the horizon where most commonly found.
- Blah Blah
1.1 INVESTIGATION A: Using a Hydrometer to Determine Particle Size
1.1.1 Theory
Particle size distribution has become a standard means for characterizing and classifying the fine earth fraction of solid soil particles, and is used to determine the soil texture class. This experiment uses a Bouyoucos hydrometer to measure the density (grams per L) of a liquid mixture (“slurry”) of soil and water.
Using the hydrometer allows us to determine soil texture by measuring the grams of the soil particles (sand, silt, and, clay) that remain suspended in the cylinder after a specific period of time. Different sized soil particles are separated by their different sedimentation rates – e.g. larger particles will settle faster in a column of water, while smaller particles remain suspended much longer in the solution (based on Stokes Law).
1.1.2 Preparation
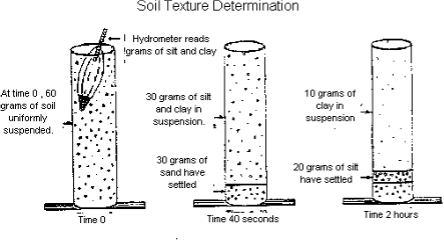
The two cylinders in this investigation each contain 60 grams of oven-dry dispersed soil – one soil is from an E horizon and one is from a B horizon. After mixing thoroughly with a stir stick, the largest particles (sand) will quickly drop to the bottom of the cylinder. After 40 seconds, only silt and clay particles are left suspended in the water. After two hours only clay-sized particles remain.
Example of a citation Knuth (1984). testing inline citation (Knuth 1984).
1.1.3 Measurements
1.1.3.1 40 Second Measurement
Carefully use the stirring rod (approximately 18 inches long with a disk on the end) to completely disperse the soil in the cylinder. This requires that you slowly lower and lift the stirring rod up and down in the cylinder until all the sediment is removed from the bottom of the cylinder.
After stirring, immediately note the time to the nearest second. Carefully and slowly insert the hydrometer (the hydrometers are extremely fragile) into the cylinder. Please refer to the figure on page 2. (Note: you may need to use your finger to stop the hydrometer from bobbing).
After 40 seconds, read the number (at liquid level) on the hydrometer.
This reading must be corrected for temperature. Add 0.4 g/L for each degree above 20ºCelcius or subtract 0.4 g/L for each degree below 20ºCelcius.
1.1.3.2 2 Hour Measurement
- Due to time constraints, two hour readings will be provided in lab.

(Note: The soil in the diagram has (60-30)/60 x 100= 50% Sand; 10/60 x100= 17% Clay; 100-50-17=33% Silt)
1.1.3.3 Calculations - note: correct readings before calculating sand, silt, and clay!
\[ Sand (\%) = \frac{M_{sample,ovendry} - 40s reading}{M_{sample,ovendry}} x 100% \]
1.1.3.4 Results
note just trying to cut out tables to see if that works
| Measurements | Sample 1 | Sample 2 |
|---|---|---|
| Sample mass (oven-dry) | 60 g | 60 g |
| 40s reading (uncorrected | g/L | g/L |
| Temperature (C) | g/L | g/L |
| 40s reading (corrected) | C | C |
| % Sand | % | % |
| 2hr reading (uncorrected) | g/L | g/L |
| Temperature @2hr (C) | C | C |
| 2hr readng (corrected) | g/L | g/L |
| % Clay | % | % |
| % Silt | % | % |
1.2 INVESTIGATION B: Using the Texture Triangle
1.2.1 Background
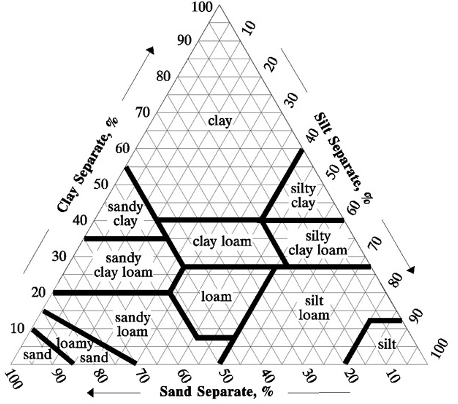
A soil’s textural class is determined by that soil’s respective content of sand, silt, and clay. The USDA textural triangle is used to classify the texture class of a soil. The sides of the soil textural triangle are scaled for the percentages of sand, silt, and clay (0-100%). Clay percentages are read along the lines from left to right across the triangle. Silt is read along the lines from the upper right to lower left. Sand along the lines from lower right to the upper left portion of the triangle. The intersections of the three sides on the triangle give the texture class name. For instance, if you have a soil with 20% clay, 45% silt, and 35% sand it falls in the “loam” textural class name.

1.2.2 Results
Using the soil particle percent data from Investigation A determine the texture class for the soil samples 1 and 2.